(This is an unpublished manuscript prepared for submission in 2000. The authors’ affiliations were current at the time of finalization of the manuscript for submission.)
Eric Post1*, Mads C. Forchhammer2, Rolf O. Peterson3, Nils Chr. Stenseth4, John A. Vucetich3, and Brian E. McLaren5
1Department of Biology, The Pennsylvania State University, 208 Mueller Lab, University Park, PA 16802 USA
2Population Ecology Group, Department of Landscape Ecology, National Environmental Research Institute, Kalø, Denmark
3School of Forestry and Wood Products, Michigan Technological University, Houghton, MI, 49931 USA
4Department of Biology, Division of Zoology, University of Oslo, P.O. Box 1050 Blindern, N-0316 Oslo, Norway
5Department of Forest Resources, Wildlife Division, Building 810, Pleasantville, St. John’s, Newfoundland, A1B 4J6 Canada
*Corresponding author: esp10@psu.edu, FAX 1 (814) 865-9131
words:
total = 3150 (text, references, and notes)
abstract = 128
Abstract—Large herbivores, whose numbers fluctuate with global climate throughout the Northern Hemisphere, can enhance net primary production (NPP) in nitrogen-limited ecosystems. Process models of global change that predict increases in terrestrial NPP following increases in CO2 and temperatures have not, however, explicitly considered the potential contribution of herbivores. Here, long-term field data from the boreal forest of Isle Royale, USA, suggest global climate and moose herbivory contribute equally to variation in annual NPP. Our individual-based estimates of nitrogen excretion by current populations of northern ungulates suggest that the extent to which large herbivores enhance vegetation response to rising CO2 and temperatures may increase the carbon sink in parts of the Northern Hemisphere by 19 – 34%, or 450 – 650 Teragrams (1012 g) annually, beyond current process model estimates.
Vertebrate herbivores exert dramatic, and often persistent, effects on primary production and soil nutrient dynamics by removing plant tissue and fertilizing the soil through urinary and fecal nitrogen deposition (1-3). They may therefore play a substantial role in the response of terrestrial ecosystems to global change, especially in northern latitudes where primary production is limited by nitrogen availability (4), and where the numbers of large herbivores vary with global climate (5, 6). Process models of ecosystem response to global change associated with an expected doubling of atmospheric CO2 over the next century (7) consistently report, for example, greater responses in tropical than in high latitude ecosystems, and this disparity is attributed to the nitrogen limitation of vegetation communities in northern latitudes (8, 9).
Recent observations of increased plant growth in northern latitudes (10, 11) apparently accord with process model predictions of enhanced primary production following increases in surface temperature or atmospheric CO2 concentration. However, the response of terrestrial vegetation to rising CO2 and temperatures, exemplified, for instance, by the increase in productivity of balsam fir (Abies balsamea) on Isle Royale with increasing temperature in the Northern Hemisphere (Figure 1), is assumed to be direct. In contrast, we suggest that the response of vegetation in northern ecosystems to global change may be substantially mediated by large herbivores via plant tissue removal and nitrogen fertilization.
On Isle Royale, USA, the collection of long-term data at all three levels of the ecosystem (predator-herbivore-vegetation) (13) has facilitated the disclosure of both direct and indirect contributions of global climate to interannual variation in productivity of balsam fir, the latter operating through the influence of snow on vulnerability of moose (Alces alces) to predation by wolves (Canis lupus) (14, 15). By statistical modeling of all three levels of this system, we quantified the contributions of both trophic interactions and global climate, due to the North Atlantic Oscillation (NAO) (12), to dynamics at each level. The detailed analysis of this system formed the basis for an individual-based assessment of the more general role of large herbivores in the response of terrestrial vegetation to expected increases in atmospheric CO2 and temperatures (7).
We used autoregressive analysis to identify the extent to which intrinsic processes (i.e., density dependence and trophic interactions) and extrinsic processes (i.e., climate) influenced the dynamics of each level of the Isle Royale system. We first identified the most parsimonious order (5) of each time series on annual estimates (Fig. 2, dots) of wolf density, moose density, and balsam fir productivity (16). We then accounted for trophic interactions by including predation in the models, indexed by the annual mean pack size of wolves during winter (15). Because wolf pack size is a strong determinant of predation rates and overall moose survival (15, 18), it is a potentially important determinant of fir productivity: annual growth of balsam fir on Isle Royale is closely linked to the numbers of moose on the island (13, 15). The most parsimonious models for each level exhibited strong explanatory power (Fig. 2, solid lines), and revealed a direct influence of global-scale climatic variation, due to the NAO, at each level (Table 1) (19).
To assess the relative contributions of trophic interactions and climatic variation to the observed dynamics of each level of this system, we used the constants and parameter estimates from the best models for each level (Table 1) to simulate the dynamics of each level with predation or climate, respectively, held constant (20). These simulations revealed that, at the top two levels, predator and herbivore, most of the observed dynamics was attributable to predation (Fig. 2, dashed lines) (20). Alternatively, at the bottom level, interannual variation in NPP of balsam fir was influenced equally by herbivore (moose) dynamics and global-scale climatic fluctuation (Fig. 2, dashed lines) (20).
The boreal forest, of which Isle Royale is an example, is the most extensive biome in the Northern Hemisphere, and one of the most extensive on Earth; it is also one of the least productive vegetation types because of its characteristically low nitrogen turnover rates (8). As well, mesic tundra, boreal woodland, and temperate mixed and deciduous forests together constitute 46% of the vegetation cover in the Northern Hemisphere, and thereby represent the most extensive northern vegetation types after the boreal forest (8); all of these vegetation types, including the boreal forest, are inhabited by large herbivores. In contrast to tropical ecosystems, in these northern vegetation types, process models of the effects of rising CO2 and temperatures on increases in NPP predict greater effects of temperature because elevated temperatures are expected to enhance nitrogen availability which, in turn, stimulates NPP (8, 9).
The boreal and temperate forests of North America, and the mesic tundra and boreal woodland of the entire Northern Hemisphere, may currently support more than 22 million moose, white-tailed deer (Odocoileus virginianus), and caribou or reindeer (Rangifer tarandus) (21). We estimate that the biomass of vegetation consumed by these herbivores totals approximately 16.3 Tg (1 Tg = 1012g) annually, or 0.3 – 0.5 percent of the total annual NPP of the ecosystems they inhabit (Table 2) (25). This level of plant biomass consumption is accompanied by a total annual fecal and urinary nitrogen excretion of approximately 26 x 1010 g N yr-1 (32). Although this comprises only 0.4% – 0.6% of the total amount of nitrogen mineralized annually in the vegetation types utilized by these herbivores, the NPP response to this level of nitrogen input totals approximately 30 Tg annually (Table 2) (34).
The response of vegetation in northern ecosystems to nitrogen fertilization by large herbivores is, upon comparison, apparently much less than vegetation response to rising CO2 and temperatures (Table 2). In mesic tundra and boreal woodland, for example, the NPP response to nitrogen fertilization by caribou is one third of the predicted NPP response to a doubling of atmospheric CO2, and merely 5% of the predicted NPP response to temperature. In the North American boreal forest, NPP response to nitrogen fertilization by moose is an order of magnitude less than NPP response to CO2, and only 1% of the expected NPP response to temperature. As well, in North American temperate mixed and deciduous forests, NPP response to nitrogen fertilization by white-tailed deer is only 13% of the expected NPP response to CO2, and approximately 5% of the predicted NPP response to temperature.
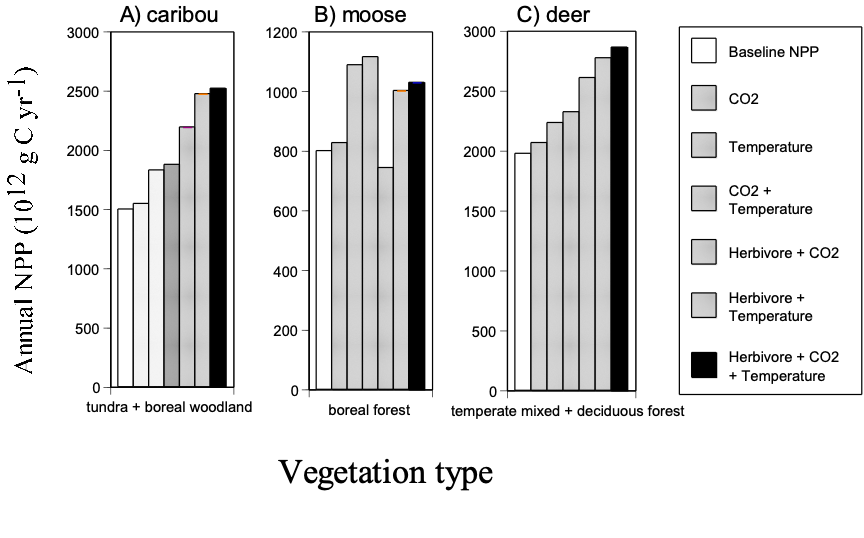
Process model estimates of vegetation responses to CO2 and temperature are, however, increases over baseline productivity expected to develop during the next century (8, 9, 31), while the potential NPP enhancement due to herbivore nitrogen fertilization occurs annually. To compare vegetation response to global change with vegetation response to large herbivores requires, therefore, estimating the effects on annual NPP of seasonal biomass off take and nitrogen fertilization by large herbivores over 100 years. Such a comparison suggests that large herbivores substantially alter vegetation response to rising CO2 and temperatures (Figure 3).
In the mesic tundra and boreal woodland, caribou enhance NPP by 42% above CO2, by 35% above temperature, and by 34% above the combined effects of CO2 and temperature (Figure 3). In the boreal forest, however, where forage consumption by moose exceeds NPP enhancement by nitrogen fertilization, moose reduce NPP response to CO2, temperature, and their combined effects by 8 – 10% (Figure 3). In the temperate mixed and deciduous forests, white-tailed deer enhance NPP by 23 – 26% above CO2, temperature, and CO2 and temperature combined (Figure 3). While enhancement of NPP by caribou likely involves increased productivity of forage species (35), we suggest that increases in productivity where white-tailed deer browse probably reflect responses of non-browsed species.
Understanding atmosphere-biosphere carbon exchange is of critical importance in predicting the consequences of rising CO2 for Earth’s climate, because carbon sequestration by the biosphere may offset anthropogenic contributions (36). Just as abandonment of agriculture and re-growth of harvested forests may represent contributions to the terrestrial carbon sink that exceed effects of CO2 and climate (37), we suggest that nitrogen fertilization of terrestrial ecosystems by large herbivores may substantially mediate terrestrial vegetation response to rising CO2 and temperatures, with especially strong, positive effects in far northern habitats used by caribou (Fig. 2). Without considering the role of large herbivores in nitrogen cycling and NPP in northern environments, process model estimates of vegetation response to global change may substantially underestimate the magnitude of the carbon sink in northern ecosystems.
References and notes
- R. J. Naiman, Bioscience 38, 750 (1988).
- D. S. Hik, R. L. Jeffries, J. Ecol. 78, 180 (1990).
- D. A. Frank, S. J. McNaughton, Oecologia 96, 157 (1993).
- P. M. Vitousek, R. W. Howarth, R. W, Biogeochemistry 13, 87 (1991).
- M. C. Forchhammer, N. C. Stenseth, E. Post, R. Langvatn, Proc. R. Soc. Lond. B 265, 341 (1998).
- E. Post, N. C. Stenseth, Ecology 80, 1322 (1999).
- IPCC (Intergovernmental Panel on Climate Change), Climate Change 1995: the Science of Climate Change (Cambridge Univ. Press, Cambridge, 1996).
- J. M. Melillo et al., Nature 363, 234 (1993).
- A. D. McGuire et al., Global Biogeochem. Cycles 11, 173 (1997).
- G. C. Jacoby, R. D. D’Arrigo, T. Davaajamts, Science 273, 771 (1996).
- R. B. Myneni, C. D. Keeling, C. J. Tucker, G. Asrar, R. R. Nemani, Nature 386, 698 (1997).
- J. W. Hurrell, Science 269, 676 (1995).
- B. E. McLaren and R. O. Peterson, Science 266, 1555 (1994).
- E. Post, N. C. Stenseth, J. Anim. Ecol. 67, 537 (1998).
- E. Post, R. O. Peterson, N. C. Stenseth, B. E. McLaren, Nature 401, 905 (1999).
- An order 1 autoregressive (AR) process indicates the existence of direct density dependence only, and suggests that intrinsic processes regulate a population. An order 2 or 3 AR process, on the other hand, indicates the presence of delayed density-dependent population regulation at lags of 2 or 3 years, and implies that interaction with adjacent trophic levels limits density (see ref. 17). We used “proc autoreg” in SAS, version 6.12, with maximum likelihood estimation of the autoregressive parameters for each time series from 1959 – 88. Although the series extend beyond 1988, the estimates for annual moose density beyond 1988 are based on aerial surveys and have not been corrected for observer error (see ref. 15). The most parsimonious dimension of each time series was determined by minimization of the corrected Akaike Information Criterion.
- P. Turchin, Nature 344, 660 (1990).
- J. M. Thurber and R. O. Peterson, J. Mamm. 74, 879 (1993).
- Wolf dynamics were best described by a first-order autoregressive process, moose were best described by a third-order autoregressive process with delayed density dependence at lags of two and three years, and fir growth dynamics were best described by a first-order autoregressive process. Corrected Akaike Information Criterion (AIC) values for each model were, for wolves: AR(1) = 4.24, AR(2) = 7.11, AR(3) = 10.6; for moose: AR(1) = -54.6, AR(2) = -62.9, AR(3) = -64.4; for fir: AR(1) = -26.1, AR(2) = -22.1, AR(3) = -21.6. Inclusion of wolf pack size improved the model for wolf population dynamics substantially (Table 1), and provided a better model of wolf dynamics than did the total density of moose, or the density of old moose and the percentage of moose calves, the two most important prey groups for wolves (see ref. 18) (Table 1). To analyze the influence of wolf predation on moose dynamics, we substituted the lag-3 delayed density dependence term in the most parsimonious autoregressive moose model with wolf pack size in the previous year. Inclusion of wolf pack size improved the model of moose population dynamics and provided a better description of moose dynamics than did models including wolf density in the previous year or fir growth in the previous year (Table 1). The best model of moose dynamics was achieved by including wolf pack size in the previous year and the NAO index of the current winter (Table 1). The dynamics of balsam fir productivity were described well by moose density at lags of one and two years, but the best description of fir dynamics included moose density at a lag of two years and climatic conditions during the current winter (Table 1).
- We estimated annual densities of wolves and moose, and the annual growth increment of balsam fir, with equations from the most parsimonious models in Table 1 and the mean values for wolf pack size or the NAO index for the period. This comparison is informative because the fit of the models in Table 1 to the empirically observed data is close for each trophic level, and because the only difference between the models (Fig. 2, heavy lines) and the simulations (Fig. 2, dashed lines), is the absence of variation in wolf pack size or climate (i.e., the simulations still contain density dependence). We compared the residual mean square error (MSE) between models with constant predation (CP) and constant climate (CC) at each level. For wolves, the CP model (R2 = 0.53) captured significantly less of the variance in observed wolf dynamics than did the CC model (R2 = 0.76) (MSECP = 0.06, MSECC = 0.032; F26,25 = 1.88, P < 0.05). For moose, the CP model (R2 = 0.05) also captured significantly less of the variance in observed moose dynamics than did the CC model (R2 = 0.34) (MSECP = 0.084, MSECC = 0.048; F29,27 = 1.75, P < 0.05). For balsam fir, however, the proportion of the observed variance in productivity that was captured did not differ between the CP model (R2 = 0.76) and the CC model (R2 = 0.82) (MSECP = 0.02, MSECC = 0.015; F25,25 = 1.33, P > 0.05).
- The current North American moose population, estimated from compilations of state- and province-specific data in the United States and Canada, is approximately 1 x 10⁶ (ref. 22); no consensus exists on the total number of white-tailed deer in North America, but a conservative estimate places the current population at approximately 16 x 106 (ref. 23); the total number of caribou and reindeer in the circumpolar north, based on compilations of local data, is estimated at approximately 5 x 10⁶ (ref. 24). Because no statistical confidence can be assigned to these point estimates, we present them with caution.
- P. D. Karns, in Ecology and Management of the North American Moose, A. W. Franzmann, C. C. Schwartz, Eds. (Smithsonian Inst. Press, Washington, D. C., 1997)
- T. R. McCabe, R. E. McCabe, in The Science of Overabundance, W. J. McShea, H. Brian Underwood, J. H. Rappole, Eds. (Smithsonian Inst. Press, Washington, D. C., 1997).
- E. E. Syroechkovskii, Wild Reindeer (Smithsonian Inst. Libraries, Washington, D. C., 1995).
- We estimated annual dry matter intake (DMI) using published estimates of seasonal DMI requirements (in g kg-0.75) and body mass for each species (caribou: 165kg; moose: 400 kg; white-tailed deer: 60 kg). We multiplied seasonal DMI within each species by the estimated total number of individuals in each species to arrive at estimates of total seasonal DMI by current populations of each species. These were summed to estimate annual DMI for each species. For caribou, seasonal DMI requirements were 86, 104, 104, and 74 g kg-0.75 for spring, summer, autumn, and winter (ref. 26); for moose, seasonal DMI requirements were 125, 145, 90, and 75 g kg-0.75 (ref. 27); for white-tailed deer, seasonal DMI requirements were 44.6, 54.2, 44.6, and 38 g kg-0.75, respectively (28, 29). For caribou, which inhabit wet/moist tundra and boreal woodland, and for moose, which inhabit boreal forest, we assumed 1 year comprised 2 months of spring, 3 months of summer, 2 months of autumn, and 5 months of winter; for white-tailed deer, which inhabit temperate mixed and deciduous forest, we assumed 1 year comprised 3 months each of spring, summer, autumn, and winter. Annual estimates of DMI were 7.33 Tg for caribou, 3.33 Tg for moose, and 5.63 Tg for white-tailed deer.
- R. D. Boertje, J. Appl. Ecol. 27, 420 (1990).
- C. C. Schwartz, L. A. Renecker, in Ecology and Management of the North American Moose, A. W. Franzmann, C. C. Schwartz, Eds. (Smithsonian Inst. Press, Washington, D. C., 1997).
- W. W. Mautz, H. Silver, J. B. Holter, H. H. Hayes, W. E. Urban, J. Wildl. Manage. 40, 630 (1976).
- C. T. Robbins, P. J. Van Soest, W. W. Mautz, A. N. Moen, J. Wildl. Manage. 39, 67 (1975).
- X. Xiao et al., Global Biogeochem. Cycles 12, 345 (1998).
- A. D. McGuire et al., Clim. Change 24, 287 (1993).
- We estimated annual metabolic fecal nitrogen (MFN) excretion and urinary nitrogen excretion (UNE) for populations of each species using published relationships between seasonal DMI (which we estimated as in ref. 25) and MFN, and between seasonal nitrogen intake and UNE, from feeding trials with captive caribou (26), moose (27), and white-tailed deer (28, 29). We multiplied our estimates of annual MFN for each species by a factor of 1.2 to account for both dietary and non-dietary sources of fecal nitrogen (see, e.g., ref. 27). Although urinary sources have been estimated to account for up to 70% of the nitrogen excreted by ruminants (33), we used more conservative estimates of 45% – 50% (refs. 26 – 29). Our estimates of annual nitrogen excretion were: 12 x 1010 g N yr-1 for caribou; 2.8 x 10¹⁰ g N yr-1 for moose; and 11 x 1010 g N yr-1 for white-tailed deer. Nitrogen excretion by circumpolar populations of caribou, and by North American populations of moose and white-tailed deer, accounts for approximately 1%, 0.4%, and 0.6% of the total nitrogen mineralized annually in the vegetation types these populations inhabit.
- D. A. Frank, R. S. Inouye, N. Huntly, G. W. Minshall, J. E. Anderson, Biogeochemistry 26, 163 (1994).
- Dave’s note
- E. S. Post, D. R. Klein, Oecologia 107, 364 (1996).
- D. S. Schimel et al., in Climate Change 1994: Radiative Forcing of Climate Change and an Evaluation of the IPCC 1992 Emission Scenarios, J. T. Houghton et al., Eds. (Cambridge Univ. Press, Cambridge, UK 1995).
- D. Schimel et al., Science 287, 2004 (2000).
Table 1. Models of population dynamics of wolves and moose, and of growth dynamics of balsam fir, on Isle Royale, USA, 1959 – 88. Bold type indicates the most parsimonious models. Numerical subscripts denote the autoregressive order of the model, and alphabetic subscripts identify covariates at the specified temporal lags.
| Species | model | AICc† | R2 | ||
| A, wolves | f1, a(t-1) | 8.23 | 0.52 | ||
| f1, b(t-1) | 4.93 | 0.54 | |||
| f1, c(t-1)* | 1.52 | 0.63 | |||
| f1, d(t)* | -6.93 | 0.71 | |||
| f1, d(t)*, NAO(t)* | -7.25 | 0.75 | |||
| f1, d(t)*, d(t-1)*, NAO(t)* | -7.40 | 0.77 | |||
| B, moose | f2, e(t-1) | -58.4 | 0.94 | ||
| f2, d(t-1)* | -63.9 | 0.94 | |||
| f2, d(t-1)*, NAO(t)* | -67.9 | 0.96 | |||
| C, fir | f1,a(t-1)* | -29.9 | 0.82 | ||
| f1,a(t-2)* | -31.9 | 0.82 | |||
| f1, a(t-2)*, NAO(t)* | -35.9 | 0.86 | |||
| f1, a(t-2)*, NAO(t)*, d(t)* | -41.1 | 0.89 |
†Akaike Information Criterion (corrected for the number of co-variates)
*P £ 0.05
1: first order autoregressive model
2: second order autoregressive model
a: annual density of moose
b: annual density of old (> 10 yrs) moose
c: annual percentage of moose calves
d: annual mean winter pack size
e: annual density of wolves
NAO: winter (Dec. – March) index of the North Atlantic Oscillation
Table 2. Estimates from the Terrestrial Ecosystem Model of baseline net primary production (NPP) and enhancement of NPP by a doubling of atmospheric CO2 concentration, by global temperature increases, and by seasonal nitrogen excretion by total populations of three northern large herbivores. All units are in 1012 g C yr-1.
| Vegetation type | Baseline NPP | NPP response to CO2 | NPP response to temperature* | NPP response to caribou | NPP response to moose | NPP response to white-tailed deer |
| global wet/moist tundra and boreal woodland | 1500† | 47† | 330 | 15 | — | — |
| North American boreal forest | 800¶ | 27¶ | 288 | — | 3.2 | — |
| North American temperate mixed and deciduous forest | 1977‡ | 90‡ | 257 | — | — | 11.9 |
*estimated from ref. (8), based on the average of the percent increase predicted by 4 climate models (Table 3).
†global estimate from ref. (8).
¶Based on global estimates from ref. (9) using the ratio of area in North American boreal forest (3.4 x 10⁶ km2) to area of global boreal forest (12.5 x 10⁶ km2).
‡North American baseline estimate from ref. (31); NPP response is estimated at 4.6% above baseline from ref. (9).
Figure legends
1. Increase in annual net primary productivity of balsam fir on Isle Royale, USA, with increases in annual Northern Hemisphere mean surface temperature (data from the Climatic Research Institute, University of East Anglia, UK; http://www.cru.uea.ac.uk) and the winter North Atlantic Oscillation (NAO) index (12) (1959-88). Annual estimates of fir productivity are based on ring-width measurements averaged over 8 trees from the west end of Isle Royale (13). Fir growth is apparently greater in years with anomalously high mean annual temperatures and cold, snowy winters (14). Our statistical modeling of all three levels of the Isle Royale system aims to determine to what extent these correlations reflect responses of fir to climate vs. responses of fir to changes in numbers of moose influenced by climate and wolf predation. The partial correlation with Northern Hemisphere temperature (r = 0.57, P = 0.001) was not significant in the full model (Table 1) (t = 1.04, P = 0.31).
2. Dynamics of (A) wolves, (B) moose, and (C) net primary productivity of balsam fir on Isle Royale, USA (1958-88). Dots in each panel at each trophic level represent annual field observations, while lines represent model estimates. The “full model” at each level represents the most parsimonious autoregressive model with covariates quantifying the contributions of intrinsic (wolf predation) and extrinsic (climate) processes. Model details are given in Table 1. “Constant predation” refers to model estimates (dashed lines) with wolf predation held constant as the mean pack size for the period. “Constant climate” refers to model estimates (dashed lines) with global climatic variation held constant as the mean value for the North Atlantic Oscillation (NAO) index for the period.
3. Estimated annual net primary production (NPP) of northern vegetation types utilized by (A) caribou, (B), moose, and (C) white-tailed deer after 100 years of rising atmospheric carbon dioxide (“CO2”), surface temperature (“Temperature”), and constant levels of plant biomass consumption and nitrogen fertilization by large herbivores (“Herbivore”). Baseline NPP and responses to CO2 and temperature were estimated with the Terrestrial Ecosystem Model (8, 9, 30, 31). To estimate contributions of large herbivores, we used the formula
NPPt = NPPt-1 + INCRNPP + (NEt/NMINbaseline)*NPPbaseline – DMIt,
where NPPt is net primary production in the current year, INCRNPP is the annual incremental NPP response to CO2, temperature, or both, based on transient process models (30), NEt is the total amount of nitrogen excreted by the herbivore population in the current year (32), NMINbaseline is the amount of nitrogen mineralized annually in the vegetation type (8, 9, 31), NPPbaseline is baseline productivity in the vegetation type (8, 9, 31), and DMIt is the total dry matter intake by the herbivore population in the current year (25). We performed 1000 simulations for 100 years for each herbivore, beginning in year 1 with baseline NPP and assuming no trend in herbivore density, but annual density fluctuations of 19% for caribou, 45% for moose, and 25% for white-tailed deer (these are averages calculated for each species based on published time series; M. C. Forchhammer, unpublished). Standard errors (x 1012) of the bootstrapped estimates involving herbivores + CO2, herbivores + Temperature, and herbivores + CO2 + Temperature are: for caribou, 7.05, 7.11, and 7.16; for moose, 2.52, 2.51, 2.51; and for white-tailed deer, 7.55, 7.99, and 7.95.
Figure 1.
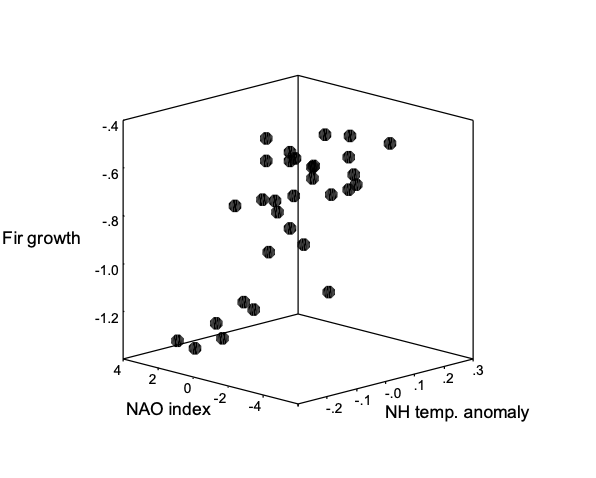
Figure 2.
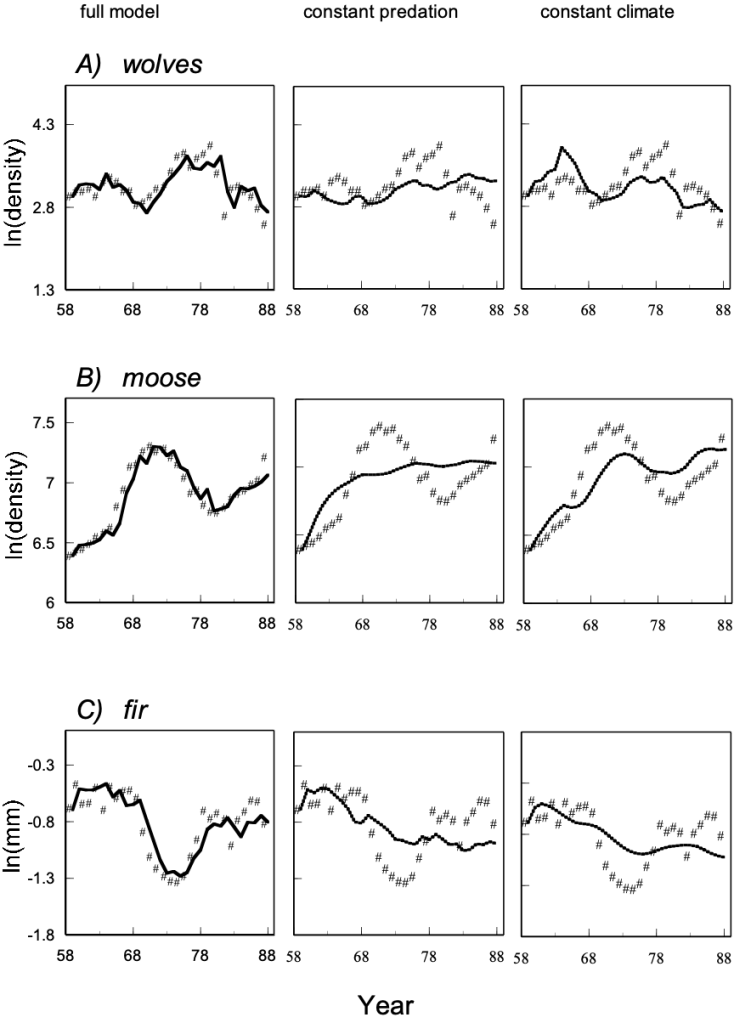
Figure 3.
 Post Lab @ UC Davis